Measure token usage precisely with Bifrost
This guide helps you measure how many input and output tokens Explyt used for a specific task. Requests go through a local Bifrost gateway, which records the statistics.
The approach works for Community mode with an OpenAI-compatible model. The built-in Explyt indicator is convenient for tracking the current chat, while Bifrost lets you set an exact time interval.
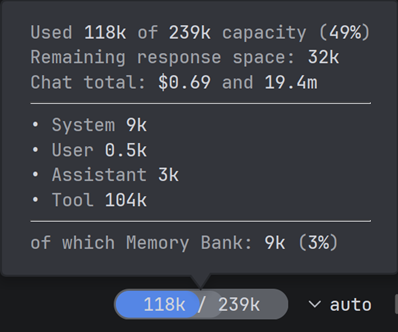
The built-in Explyt counter shows the usage of the current chat.
What you need
Before you start, make sure you have:
- Docker installed and running;
- an OpenAI API key;
- Explyt in Community mode;
- the OpenAI model you will use for the task.
Enter your real OpenAI key only in Bifrost. Do not add it to Explyt settings, project files, commands, or chat messages.
Bifrost only counts requests that pass through it. Calls made with the same key directly to OpenAI will not appear in the local statistics.
1. Start Bifrost
Open a terminal and pull the image:
docker pull maximhq/bifrost
Run the container and attach a persistent volume for settings and logs:
docker run --name bifrost -p 8080:8080 -v bifrost-data:/app/data maximhq/bifrost
Open http://localhost:8080 in your browser. If the container already exists and is stopped, start it with:
docker start bifrost
Installation details are in the official Bifrost guide.
2. Add the OpenAI key to Bifrost
- In the Bifrost interface, open
Models | Model Providers. - Click
Add New Providerand selectOpenAI. - Click
Add Key, give it a recognizable name, and paste the OpenAI API key. - Allow the model you will use and save the settings.
The field names and provider parameters are described in the OpenAI provider documentation.
3. Connect Bifrost to Explyt
Open the Explyt settings and switch to Community.

Click the + button next to the provider list.
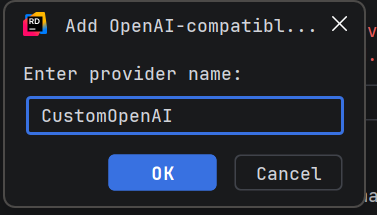
Enter a recognizable name for the new provider and click OK.
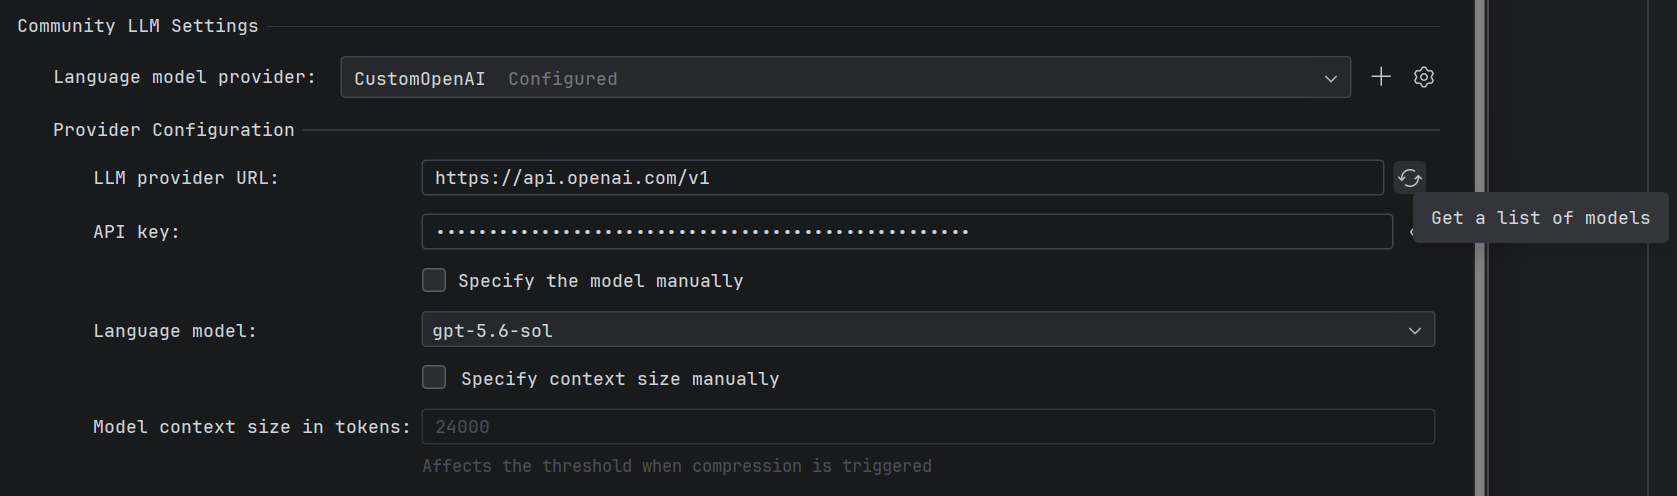
Specify:
- URL:
http://localhost:8080/v1(the Bifrost address); - API key: the Bifrost virtual key, if authorization is enabled in Bifrost;
- model: an identifier in the form
openai/<model>, for exampleopenai/gpt-4o-mini.
If Bifrost authorization is disabled, you can leave the API key field in Explyt empty. If Explyt requires a value, first enable authorization in Bifrost and create a separate virtual key. Do not paste your real OpenAI key into Explyt.
Click Get a list of models, wait for the models to load, and select the one you need. Before measuring, double-check the selected model.
Click Save; the settings will close.
Create a new chat and send a short, safe request. If Explyt responds, the connection works.
4. Prepare a clean measurement
The result is affected by every request that passes through the selected Bifrost key within the given interval. Background tasks, parallel chats, and other clients will also end up in the statistics.
To measure a single task more precisely:
-
Use a separate Bifrost virtual key and a separate OpenAI key for Explyt.
-
Stop other clients and do not run parallel chats through this key.
-
Create a new Explyt chat.
-
Before sending the task, record the current UTC time in RFC3339 format:
START_TIME=$(date -u +"%Y-%m-%dT%H:%M:%SZ")
echo "$START_TIME" -
Run the task and wait for all agent and subagent actions to finish.
-
Immediately after completion, record the end time:
END_TIME=$(date -u +"%Y-%m-%dT%H:%M:%SZ")
echo "$END_TIME"
Do not restart the container or delete the bifrost-data volume until you have collected the statistics.
5. Get the statistics for the interval
Get the available filter values from Bifrost:
curl --silent --show-error "http://localhost:8080/api/logs/filterdata"
In the selected_keys object, find the key by its name and copy its id.
Select the id of the OpenAI key you added for the measurement:
KEY_ID="<OPENAI_KEY_ID>"
The method and response fields are described in the available filters reference.
Request the aggregated statistics for only this key and interval:
curl --silent --show-error --get \
  "http://localhost:8080/api/logs/dashboard" \
  --data-urlencode "selected_key_ids=$KEY_ID" \
  --data-urlencode "start_time=$START_TIME" \
  --data-urlencode "end_time=$END_TIME"
In the response, look at overview.stats.total_tokens. The breakdown contains prompt_tokens, completion_tokens, and
total_tokens. To check individual requests, use the same filter with the log:
curl --silent --show-error --get \
  "http://localhost:8080/api/logs" \
  --data-urlencode "selected_key_ids=$KEY_ID" \
  --data-urlencode "start_time=$START_TIME" \
  --data-urlencode "end_time=$END_TIME"
The parameters of both methods are described in the Bifrost reference:
If the Management API is protected, add the bearer token issued by Bifrost to all /api/logs/* requests:
BIFROST_MANAGEMENT_TOKEN="<BIFROST_MANAGEMENT_TOKEN>"

curl --silent --show-error --get \
  "http://localhost:8080/api/logs/dashboard" \
  --header "Authorization: Bearer $BIFROST_MANAGEMENT_TOKEN" \
  --data-urlencode "selected_key_ids=$KEY_ID" \
  --data-urlencode "start_time=$START_TIME" \
  --data-urlencode "end_time=$END_TIME"
Do not put your real OpenAI key in this header.
6. Verify the result
The measurement is complete if:
- the log contains Explyt requests between
$START_TIMEand$END_TIME; - the entries belong to the correct
selected_key_ids; - the aggregate shows input, output, and total tokens;
- the interval contains no requests from other chats or clients.
If the log contains extra requests, repeat the task with a separate key and a narrower interval. If there are no entries, check the URL in Explyt and make sure the requests actually go through Bifrost.
Measurement limitations
Bifrost measures the actual model requests that pass through the gateway. A single agent task may consist of several requests, including tool calls and subagent work. So the total for the interval is usually larger than the number of tokens visible in a single message.
The result applies only to the selected key and the measurement interval. It does not show the usage of calls that bypassed Bifrost, and it does not predict the usage of the next task.
Related pages: