A code cleanup harness has to expose what unfamiliar or AI-generated code does at runtime, not merely make its source look tidier. Runtime-only bugs can consume hours while a coding agent cycles through plausible theories and moves logging from one place to another; the decisive fact may be an object value, the runtime class behind an interface, or the earlier stack frame where state first became wrong. Explyt starts the JetBrains configuration that already reproduces the failure and lets the agent inspect those facts in the paused process, alongside the connected dependency code. The team can repair the behavior it actually observed and preserve the case as regression evidence.
A good CLI agent already does real debugging work
Take a payment test that fails only when two promotions overlap. The total is off by one cent. A strong CLI agent can read the failure and nearby code, search for related tests and names, and form hypotheses about discount currency, early rounding, or the active rules implementation. It may then choose a test command or add logs around the most likely explanation.
When the agent chooses the right reproducer and observability points, this can work very well. In other runs it may stop at a plausible source-level explanation or spend several iterations adding and moving logs.
AgentLens shows how often that plausible theory becomes a trap. In its realistic coding trajectories, 8 of 32 reviews found shifting or contradictory diagnoses during debugging, while 14 of 32 caught premature or misleading success claims; wrong Run Configurations added another source of churn. This is why Explyt's debugging loop keeps the hypothesis tied to the reproducing configuration and the evidence in the paused process.
The gap appears when the source code supports several plausible explanations and the next answer exists only in the running process.
Money calculateTotal(Order order) {
    var subtotal = priceCalculator.subtotal(order);
    var discount = promotionEngine.discountFor(order);
    return subtotal.subtract(discount).round(currencyRules.forOrder(order));
}
The CLI agent can search for implementations of CurrencyRules and read the likely candidates. Explyt's repository-understanding workflow can resolve the symbol graph and dependency version, but that still does not establish which implementation handled this call, what scale it returned, or whether subtotal was already wrong when the method began. Those facts belong to this execution.
Where logs stop being enough
A CLI agent may add logs where its current hypothesis says to look. That can help, but the instrumentation is planned before the next run. If the hypothesis is wrong, another edit and run are needed, and the temporary code must be removed later. Controls that prevent avoidable AI cleanup can bound those edits, but they cannot reveal a value that was never logged. Large test or application logs also consume context unless the relevant lines are easy to isolate.
A debugger changes the question. Instead of deciding every observable value in advance, the agent can pause the process, inspect the current frame and objects, evaluate the stack, and move the breakpoint as the evidence changes its theory.
Environment reproduction is another fault line. A project script can be the authoritative way to run a service, and Explyt should not replace it merely because an IDE exists. But many enterprise projects also have working local state encoded in JetBrains Run Configurations: the selected SDK and module, VM options, environment variables, Spring profile, and working directory. Reconstructing that state in a new shell command can produce a different failure from the one the developer sees.
The same ambiguity appears at dependency boundaries. A CLI agent can search the repository and inspect files available to it, but the exact source for the dependency version connected to the project may not be present. A correct-looking hypothesis can therefore describe the wrong implementation.
Start from the configuration that already reproduces the bug
In supported IDEs and configuration types, Explyt can find and run existing JetBrains Run Configurations. For the payment failure, the agent can select the focused test configuration, reproduce the assertion, set a breakpoint near calculateTotal(), and launch that configuration under the IDE debugger.
The evidence is scoped to the paused execution:
- the actual
subtotalanddiscountvalues; - the runtime class behind
currencyRules; - the frame that assembled the order and promotion state;
- the point at which the extra cent first appears.
Suppose discount has the expected currency and amount. The first hypothesis weakens immediately. The wrong cent appears only after round(), and the runtime CurrencyRules class is not the implementation the agent expected from reading the most obvious configuration file.
Now the next action is specific. The agent follows that runtime implementation and its caller rather than adding broader logging around the promotion engine. If the values contradict the theory, it revises the theory.
This is not proof about every possible execution. It is direct evidence about the failing run under investigation.
The exact Run Configuration support varies by IDE and configuration type. IntelliJ IDEA, Android Studio, and PyCharm have the broadest documented support; Rider and WebStorm support narrower sets. Check the current Run Configurations documentation and feature matrix before choosing a pilot project.
Follow the runtime path into the dependency you actually use
The active rounding implementation may live in an internal JAR or an older framework dependency, a common complication when cleaning up an inherited AI-built project. Explyt can inspect attached sources and decompile classes from the dependency connected to the project. The agent can check the actual signature and implementation before choosing the next breakpoint or proposing a fix.
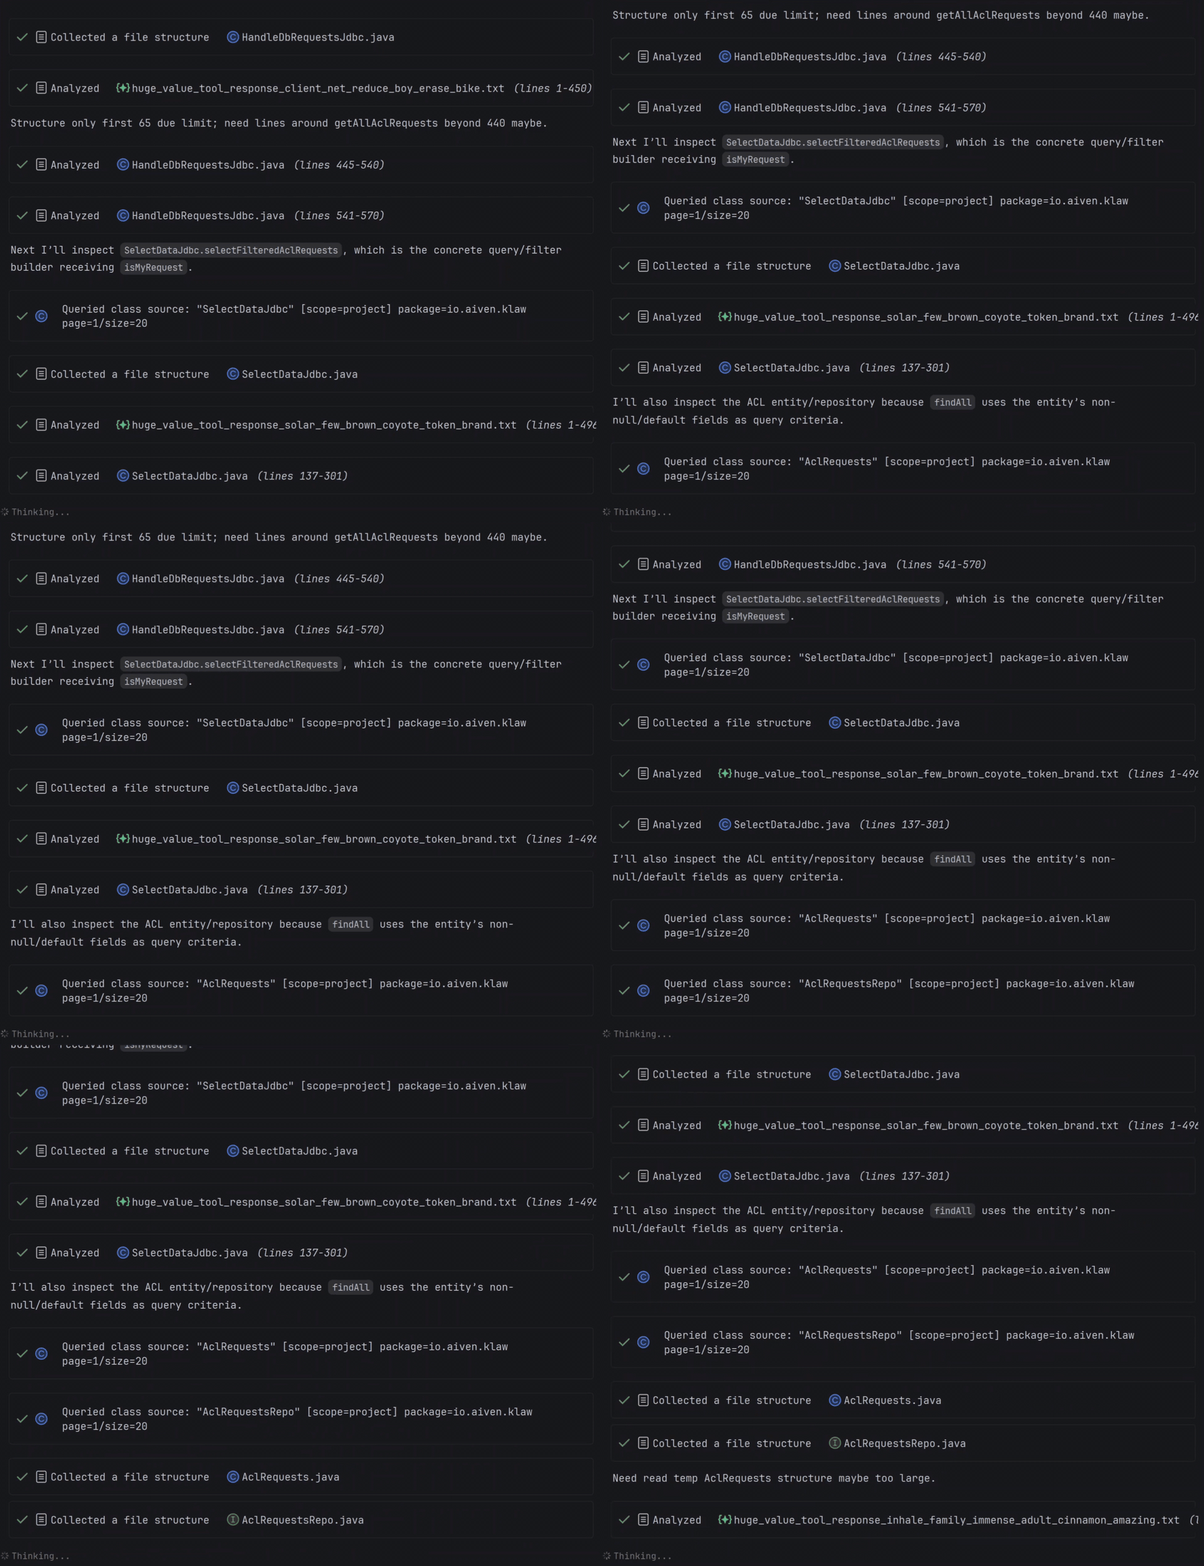
A CLI agent can run shell commands to locate a JAR or look for dependency sources, but it does not automatically receive the decompiled class and exact connected version as project facts. In Explyt, symbol navigation, the project classpath, dependency source, debugger state, code changes, and test execution come from the same JetBrains project.
Debugging dependency code still depends on source mappings, debug information, optimized code, native boundaries, and debugger settings. Explyt cannot manufacture runtime detail that the debugger itself does not have.
Leave a regression test, not just a diagnosis
Once the wrong rounding implementation is identified, the agent can change the code and rerun the same focused configuration. The team still needs a test that fails if the bug returns.
In IntelliJ IDEA and Android Studio, Test Generation from Execution can capture a selected Java or Kotlin call through JDI. The documented capture includes arguments, return values, exceptions, call hierarchy, and object state. Explyt can use the selected call as the starting point for a unit test, reconstruct simple objects, and mock external dependencies; the test-generation workflow follows that evidence through execution and coverage.
The generated assertions and mocks still require review. One captured call protects one observed case; it does not prove that every promotion or rounding path is correct. Reintroducing the defect should make the test fail, and mocks must not replace the behavior the test is supposed to protect.
Runtime state can contain secrets, personal data, tokens, or sensitive values hidden in object graphs. Use capture only in approved environments, inspect fixtures before committing or sending them to a model, and replace sensitive values with safe equivalents. When the bug exposes a security-relevant data path, debugger evidence can complement static vulnerability analysis. Do not attach a debugger to production or a remote JVM unless the team's access and data-handling policies explicitly allow it.
Runtime facts change the debugging loop
Claude Code or another CLI agent can search the code, make careful edits, run shell commands, and reason from whatever output it obtains. Explyt adds a consistent debugging loop with direct access to the runtime facts that JetBrains IDEs already expose.
The JetBrains-native loop is connected:
existing Run Configuration → breakpoint → values, stack, and runtime type → connected dependency source → revised hypothesis → fix → regression test
The model is still responsible for forming and revising hypotheses. The developer still reviews the evidence and the fix, ideally through a separate final patch review. What changes is the amount of setup between the agent's question and a runtime fact the IDE already knows.
Debugging is part of the cleanup harness because it turns an opaque failure into inspectable maintenance evidence: the configuration that reproduces it, the runtime value that disproved competing theories, the execution path into the actual implementation, the reviewed fix rerun against the same case, and a regression test. Those artifacts let the next engineer see which behavior was repaired and how to check it again. The team no longer has to treat the most convincing source-level diagnosis as proof that unfamiliar code is safe to keep.
Install Explyt from JetBrains Marketplace or check the current debugging and IDE support.