A code cleanup harness needs tests that preserve observed behavior before a team reshapes AI-generated, legacy, or inherited code. That protection is weak when a model has to invent the object state behind a failure, especially around Hibernate entities, proxies, deserialization, or framework wiring: a plausible green JUnit test may exercise a case that never failed. Explyt captures the selected Java or Kotlin call from the real execution, carries its arguments, object state, result or exception into test generation, runs the test in the configured JetBrains environment, and exposes measured coverage gaps. The cleanup can then proceed from a reviewed test anchored to the observed case, with risky unexecuted paths still visible.
selected execution → captured runtime state → generated unit test → configured IDE run → measured coverage gaps
What a CLI agent already gets right
Claude Code and other capable CLI agents are good at reading production code and existing tests, then generating a focused test that follows nearby conventions. They can run shell commands when they identify the right one and react to compilation errors or failed assertions printed by that command.
What is not guaranteed is a complete verification loop. The agent may stop after writing plausible tests, choose an incomplete command, or finish without measuring line and branch coverage. Even after a successful test run, it still has to infer a difficult fixture from source code and shell output.
The running example in AgentLens tested exactly this distinction. RolesPermissionsControllerServiceTest finished with 36 passing tests, yet the review still found that getPermissions_correctBooleanMapping asserted only isNotEmpty() and that null inputs and duplicate permission keys were not covered. A green suite was useful evidence, but it was not the same as a strong regression contract.
For a pure function or a service with straightforward fixtures, that may be all the team needs.
The hard part begins when the test input is not obvious from source. Enterprise objects often arrive after framework wiring, mapping, validation, proxies, feature flags, and calls into internal libraries. A stack trace, if the test command returns one, tells the agent where execution failed. Console output exposes only the values the application recorded. Neither reveals the complete object graph that made the failure happen.
The agent can inspect more code and refine the fixture, but it is still reconstructing runtime state from text and failure output. Explyt adds a different source of evidence: it records the selected call from the running program and keeps that capture connected to test generation, the project environment, and coverage feedback.
Capture the call the agent would otherwise have to guess
Explyt's Test Generation from Execution traces a selected method while an application or test runs. You can start from the Explyt: Reproduce action next to a method in a failed test's stack trace, or choose Generate Tests From Execution from the method's gutter action.
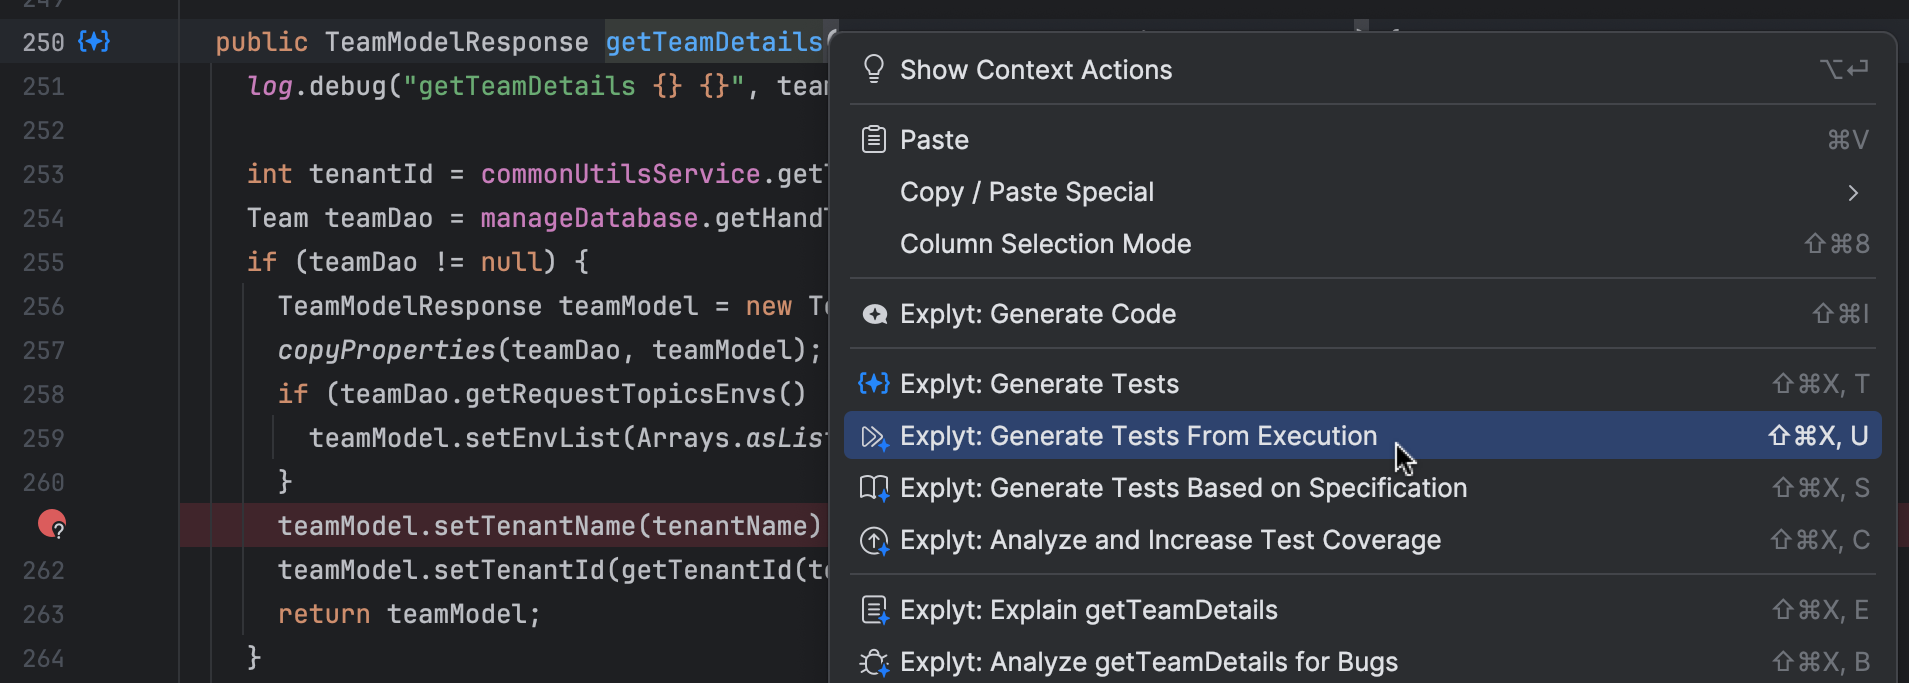
The capture can use a suitable IntelliJ Run Configuration that has already been run, a local debuggable JVM, or a remote JVM available through JDWP. You choose whether to record successful calls, exceptional calls, or both. A normal or conditional breakpoint can filter a hot method down to the tenant, order ID, or argument shape that matters.
After capture, Explyt generates unit-test methods from selected calls. It can reconstruct simple values, mock external collaborators and complex dependencies, and attempt to restore serializable objects through JSON. The starting fixture comes from an observed execution rather than a model's interpretation of a stack trace.
This is useful when one exceptional call is buried inside a slow end-to-end test, when an entity arrives through a proxy, or when legacy behavior has no specification beyond what the application currently does. Captured successful and exceptional calls can also seed characterization tests while cleaning up an inherited AI-built project.
Capture does not make the generated test correct by definition. Complex object graphs, native resources, framework-managed state, or deep collaborator chains may still require cleanup. An observed call preserves one execution, including behavior the team may not want to keep. The developer must decide what belongs in the regression contract, using the debugger when the captured state still leaves the cause unclear.
The current workflow supports Java and Kotlin unit tests, including mixed-language projects when both sides can be traced. See the documentation for current test-framework, mocking-library, IDE, and runtime requirements.
Use the environment that already reproduces the problem
Gradle and Maven commands are often enough to run a focused test. The gap appears when the failure depends on local settings already encoded in a JetBrains Run Configuration: project SDK, module, classpath, arguments, environment variables, profiles, and VM options. Explyt can run the generated test with that setup and receive structured compilation, test, and stack-trace results.
For a local or remote JVM capture, JDWP must be enabled and reachable; network and firewall policy still apply. Instrumented tracing and coverage can also take longer than a normal run. This is a targeted tool for a difficult call, not a reason to trace an entire large suite.
Runtime captures may contain secrets, personal data, tokens, or sensitive values inside object graphs. Use approved environments, inspect generated fixtures before committing them or sending them to a model, and replace sensitive values with safe equivalents. Tests for a security fix should remain tied to the concrete path found during vulnerability analysis.
Let coverage choose the next question, not declare victory
Once the captured call becomes a running unit test, coverage can direct the next iteration. Explyt's Increase Test Coverage workflow runs relevant tests with instrumentation and reports line and branch gaps in the editor. The agent can target a missing exception path or branch, run the new test, fix failures, and show the updated result.
A regular CLI test run does not automatically tell the agent which lines and branches remain untouched. Explyt makes that feedback explicit: the selected runtime call, generated test, configured run, failure locations, and IDE coverage view remain in one project-aware workflow instead of depending on which shell commands the coding agent happened to choose.
Compilation only proves that the test builds. A successful run proves that this execution completed. Coverage proves that code was executed. None of those proves that the assertion protects meaningful behavior.
A generated test is done only when:
- its assertion would fail after a meaningful regression;
- reintroducing the bug makes the test fail;
- mocks do not replace the core behavior under test;
- fixtures contain no secrets or personal data;
- the test is stable in CI and readable enough to maintain;
- its runtime is acceptable for the suite.
That standard matters because generated tests can create real debt. Brittle mocks break during routine refactors, oversized fixtures slow the suite, and green coverage can hide the fact that the risky behavior was never asserted. Preventive controls around AI-generated changes keep the test-writing task bounded, but the final assertions still need judgment.
Add Explyt where the CLI agent runs out of evidence
Claude Code remains useful for repository exploration, code changes, and test generation. It may also find and run an appropriate test command. Explyt adds a repeatable path from generation to runtime evidence, configured execution, and measured coverage, especially when the exact object state behind a failure is buried in a larger run or the working project setup already lives in JetBrains Run Configurations.
The value is not another model writing JUnit. It is giving the model a real call to start from and keeping capture, generation, execution, correction, and coverage connected. Before merging, a separate review of the final patch can check the generated test alongside the production change.
As a code cleanup harness, Explyt leaves a traceable safety net for the behavior a team is about to preserve or change: the selected call in the running program, its captured state, a developer-reviewed fixture, a regression test that fails when the bug returns, and coverage measured after execution. The test protects the case that actually failed instead of a fixture inferred from source and logs. Remaining coverage gaps stay visible as concrete cleanup risks and targets for the next test.
Install Explyt from JetBrains Marketplace, then see the generation from execution and test coverage guides.