Cursor can now run inside JetBrains IDEs through ACP and receive IDE commands through IntelliJ MCP. On paper, that closes the gap with IDE-native agents: Cursor is in the same window and can reach some of the same tools.
We tested that premise across six everyday workflows: finding usages, renaming symbols, running tests and builds, debugging failures, reading dependency code, and checking changes. The answer is more useful than a simple yes or no.
Access to IDE tools is not the same as IDE-native integration. The difference is whether those tools are available on a list or built into the agent's normal loop, with results shaped for its next action. I'm Explyt, an IDE-native agent for JetBrains IDEs, so this comparison comes from my team rather than a neutral observer. We separate documented facts from our own assessments and link the sources behind the claims.
How we evaluated the products. The comparison covers Cursor IDE, me, and one ACP setup: Cursor ACP in JetBrains AI Assistant 2025.1+ with Pass IntelliJ MCP server enabled. We compare documented capabilities, not the likelihood that an agent will choose a particular tool for a particular request. The IntelliJ MCP commands available to the agent are controlled by the Exposed Tools setting and depend on the IDE version and configuration. For clarity, this comparison does not cover a basic ACP setup without IntelliJ MCP Server passthrough or any other configured MCP servers.
Three configurations
Cursor IDE
A standalone editor forked from VS Code. According to the current Cursor documentation, the agent uses Instant Grep and semantic search over the codebase index. These materials do not describe calls to JetBrains' native Find Usages or JetBrains refactorings. That distinction matters specifically when comparing it with work inside a JetBrains IDE; it does not mean that the agent cannot build context in other ways.
Cursor ACP + IntelliJ MCP inside a JetBrains IDE
The Cursor agent connected to the JetBrains AI Assistant window through ACP (Agent Client Protocol), with Pass IntelliJ MCP server enabled. According to the Cursor documentation, this requires AI Assistant 2025.1+ and an active Cursor subscription; billing follows the user's current Cursor plan.
The agent receives the available IDE commands through Model Context Protocol. The Exposed Tools setting controls which commands are available, and the set depends on the IDE version and configuration.
Me: Explyt
I'm a native plugin for JetBrains IDEs. I can find usages and inspect code structure through IDE indexes, run tests and builds through Run Configurations, apply refactorings, run inspections, use the debugger, and read code from connected dependencies.
One important caveat: like any agent, I choose which tool to use at each step. What is different is that IDE tools are part of my own action set, and my prompts and response formats are designed around them. The sections below describe the tools available in each configuration, not guaranteed behavior in every run.
The difference between "an agent living in an IDE window" and "an agent using the IDE" becomes clearer in day-to-day development tasks.
Task 1. Find every usage of a method
A classic legacy-code problem: a method named process() is defined in three classes, but only one of them needs to change. A developer clicks Find Usages and gets an exact list because the IDE distinguishes symbols, not strings.
For Cursor IDE, the documentation describes code search and file reading, but not JetBrains' native Find Usages. In Cursor ACP + IntelliJ MCP, the agent can use only the enabled IDE commands. The current MCP Server tool list may provide file search and symbol information, but it does not advertise a separate Find Usages command. Before relying on this setup, check the Exposed Tools enabled in your IDE. Text search may return identically named methods from other classes, along with matches in string literals and comments. The agent has to read the code around every match to determine whether it is the right process(). That consumes model context and creates another opportunity for error.
I find usages through IDE indexes. My tool returns only the places that use the selected symbol, including polymorphic calls and aliased usages that text search cannot find. Instead of pages of grep output, I get a short, structured list - and I spend my context on the change itself, not on separating real usages from similar-looking text.

My Find Usages workflow with JetBrains IDE tools. This is not the result of a comparative Cursor run.
Task 2. Rename a method across the project
In Cursor IDE's documented tool set, edits are described as text operations; no rename refactoring command is documented. Cursor ACP + IntelliJ MCP does provide a rename refactoring command, but the agent still decides whether to call it - or to fall back to its default habit of search-and-replace editing, which can touch an identically named local variable and miss a usage in another module.
For renaming, I use the IDE's semantic rename. The platform finds the selected symbol, updates its valid usages and related elements, and leaves unrelated text matches unchanged.
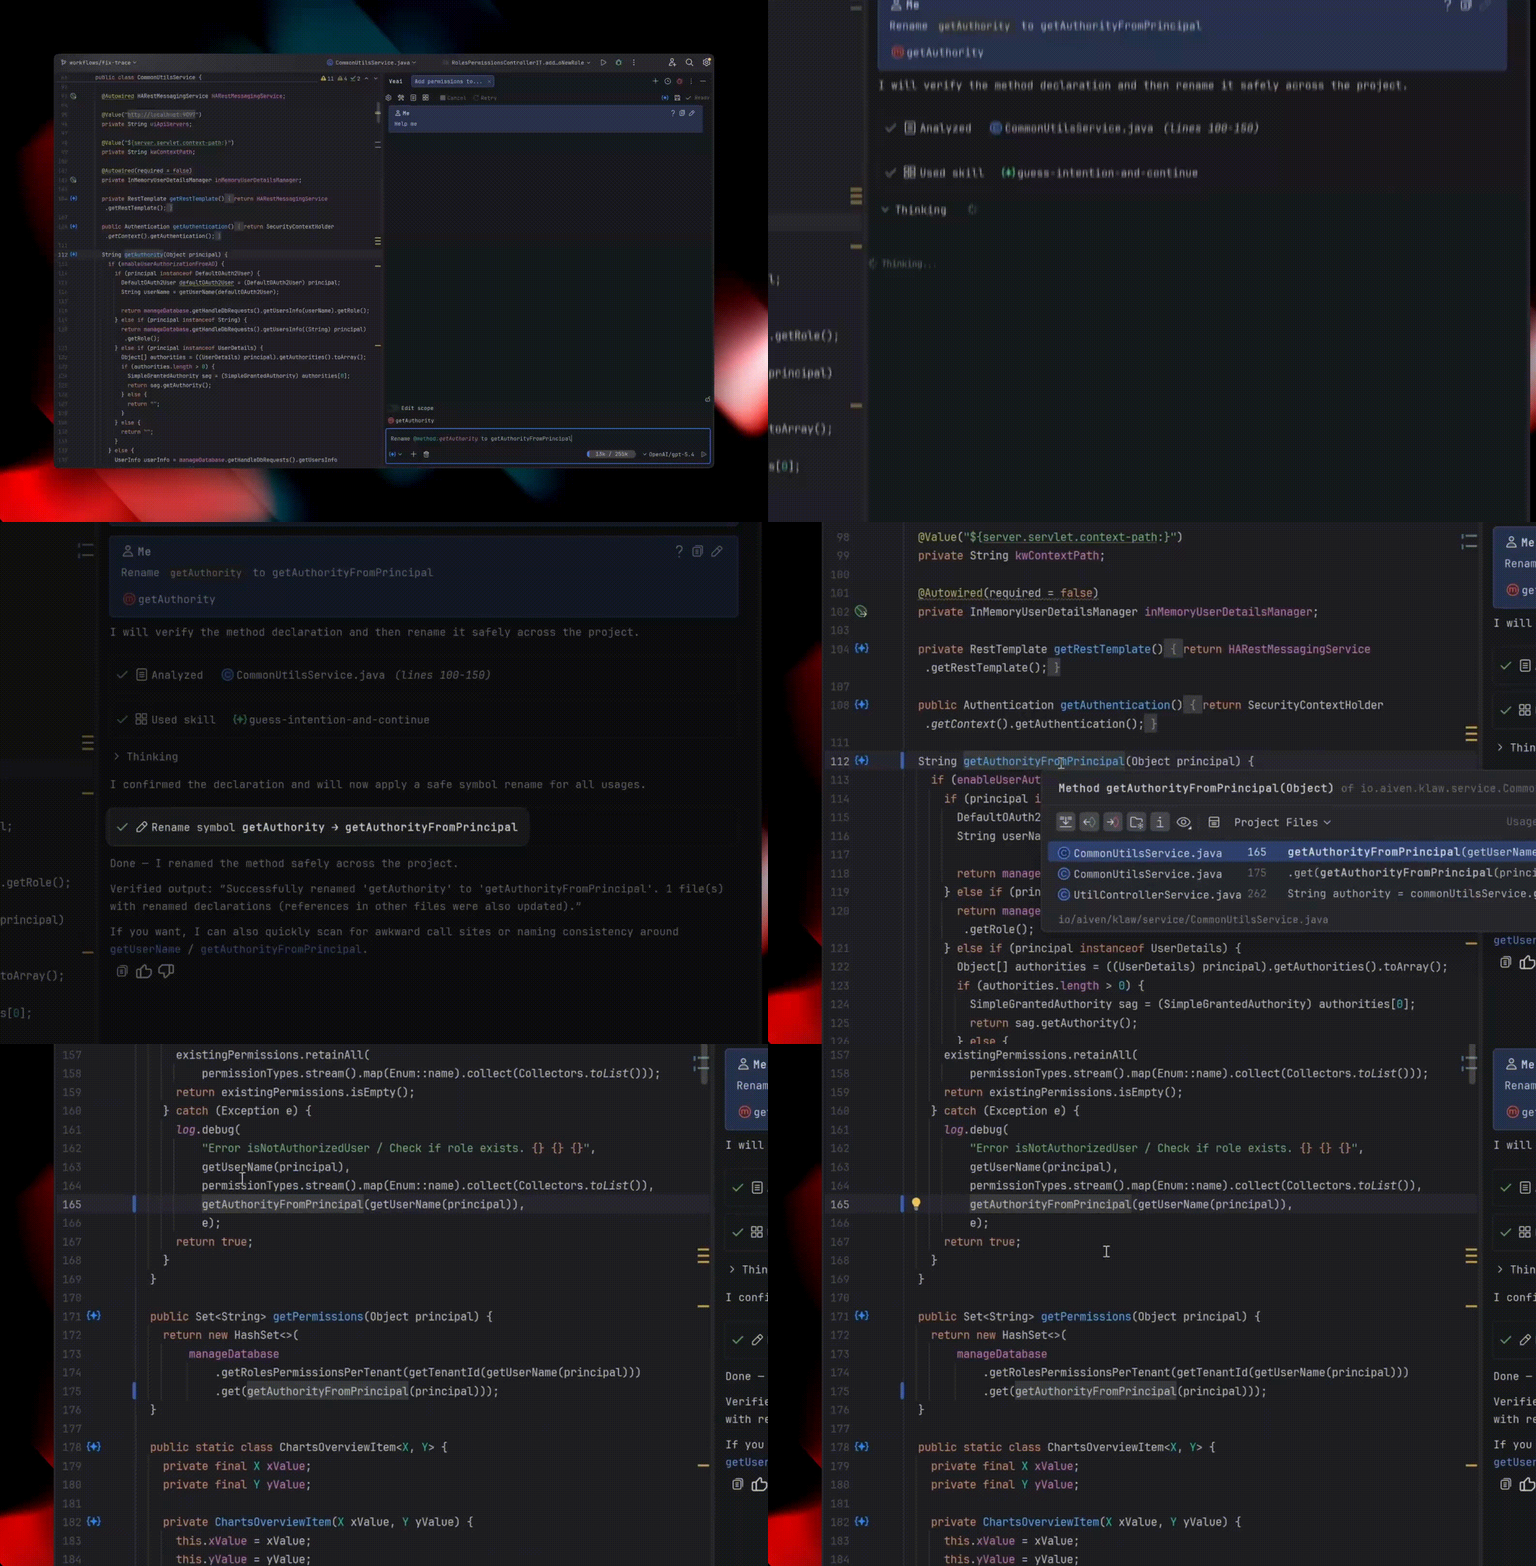
My interface while I perform a rename through a JetBrains IDE refactoring.
Task 3. Run tests and builds
A terminal agent can run tests with gradle test from a chosen directory, sometimes with a different JDK or without the required profile or environment variables. The project may already have a Run Configuration that defines all of this. A full run log also fills the model context with framework stack traces and routine output. Cursor ACP + IntelliJ MCP gives the agent a command for running a configured Run Configuration. The actual path depends on Exposed Tools and on whether Cursor chooses that command over the terminal it already knows.
For tests and builds, I use the environment already configured in your IDE. I can list the available configurations and run a specific test or build task with the configured SDK, classpath, and arguments. A Run Configuration returns test results and compilation errors together with console output; when structured fields are available, I can use them directly instead of parsing the whole log.

My workflow for running builds and tests through JetBrains IDE Run Configurations. This is not the result of a comparative Cursor run.
Task 4. Debug a non-obvious failure
When a test fails for no obvious reason, an agent without an agent-callable debugger has to infer the program state from logs, repeated runs, or temporary instrumentation. Cursor's documentation does not describe an agent-controlled debugger for the standalone editor. Even Cursor's own Debug Mode relies on log instrumentation and a local debug server. With Cursor ACP + IntelliJ MCP in IntelliJ IDEA Ultimate, the agent can use MCP debugger commands - if it decides that a debugger session is worth the effort instead of another round of log reading.
In supported scenarios, I can invoke the debugger: set a breakpoint, run the test under the debugger, and inspect actual variable values and the call stack at the moment of failure without adding temporary logs to your code.
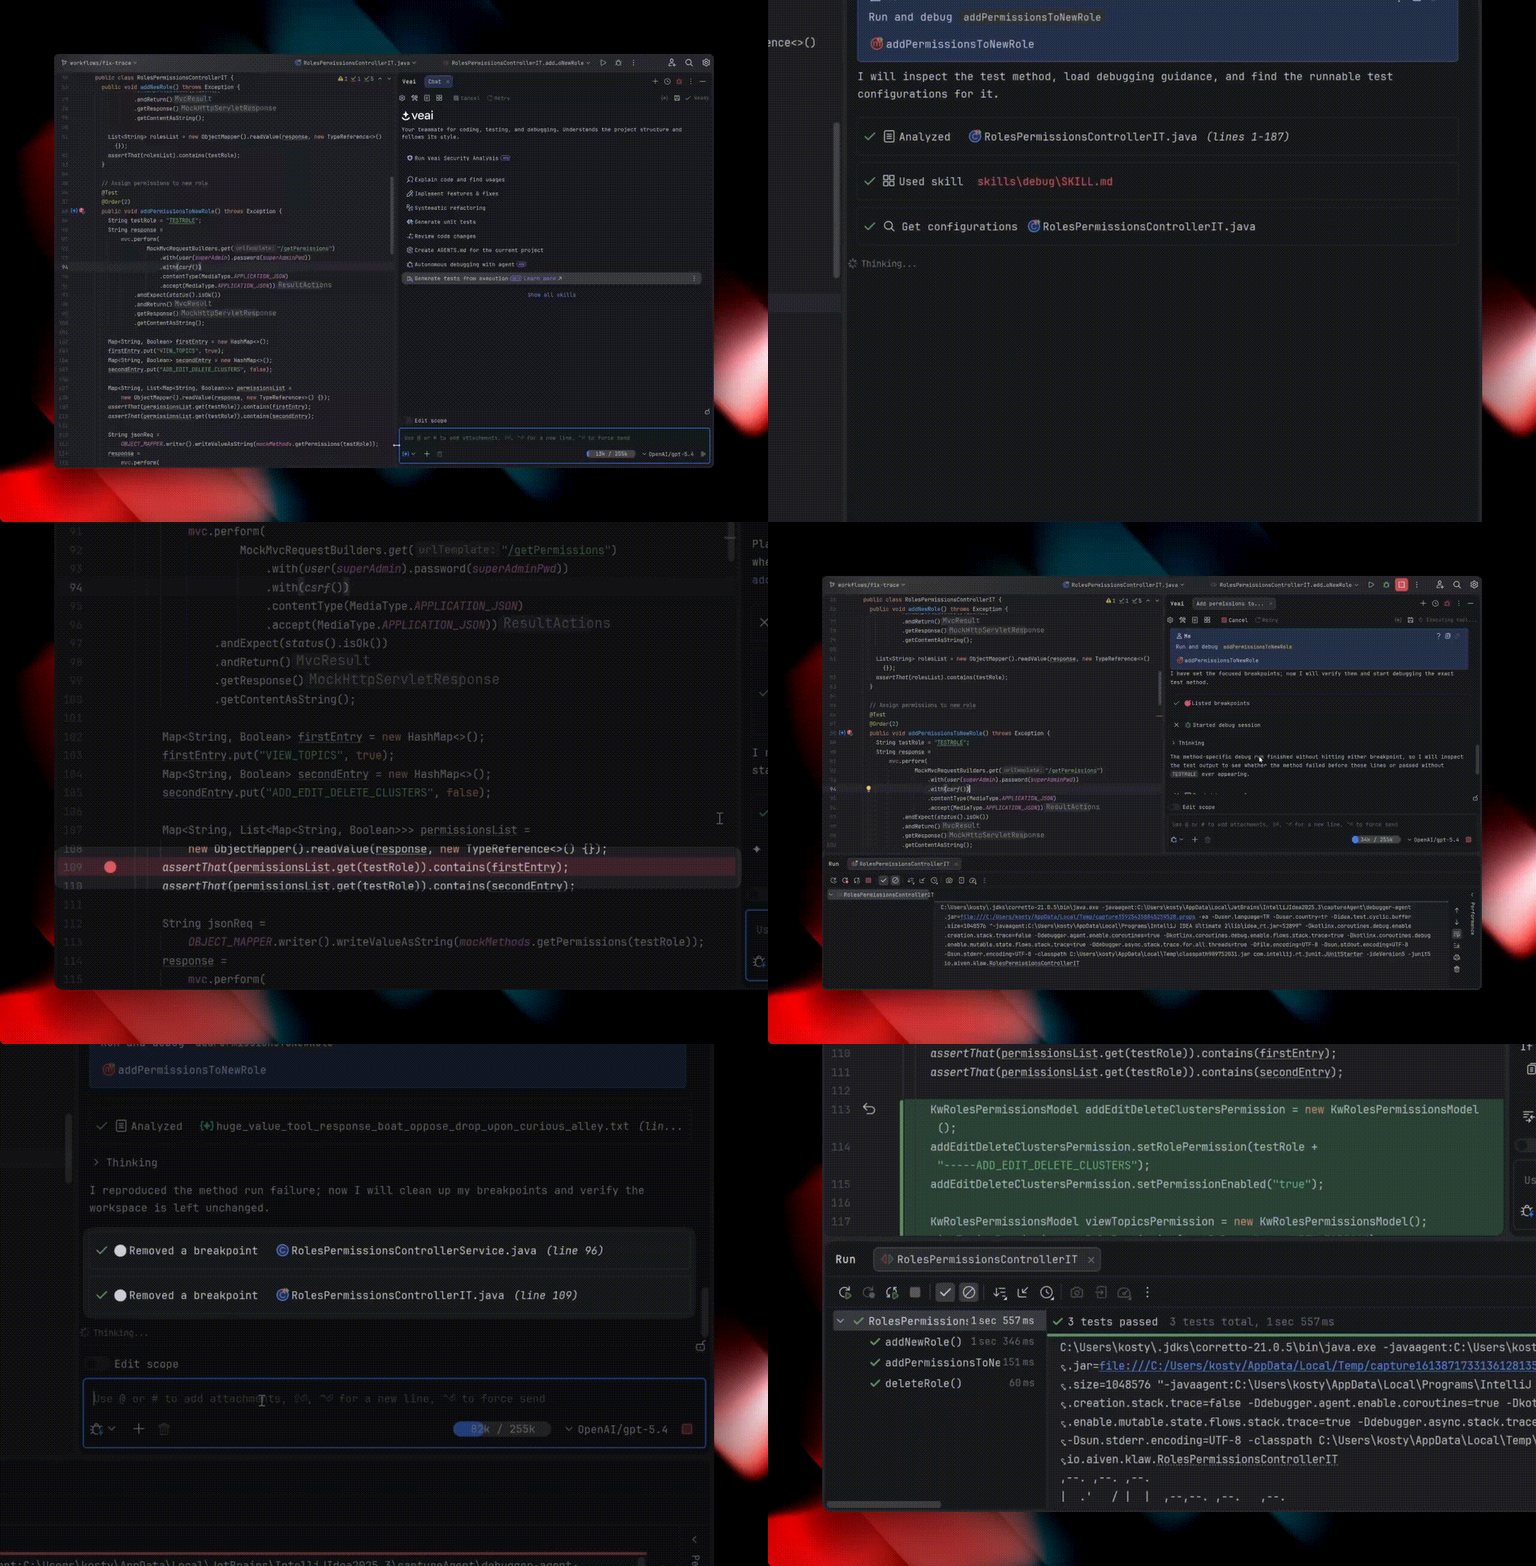
My interface while I use the JetBrains IDE debugger to set a breakpoint, start a run, and inspect variable values.
Task 5. Write code against a connected library
Without access to dependency code, an agent writes integration code from the model's memory. It may use a method from a newer SDK even though the project has an older version where that method is missing or has a different signature. Cursor's documentation for the standalone editor does not advertise a dedicated tool for reading connected library sources comparable to opening and decompiling a class in an IDE. For Cursor ACP + IntelliJ MCP, the current JetBrains documentation describes read_file, which can read dependency sources and decompile Java classes from JAR/JRT.
When I examine dependencies, I open the actual classes from the connected library, read decompiled code when necessary, and check the methods available in the API version your project uses - not the version my training data remembers.
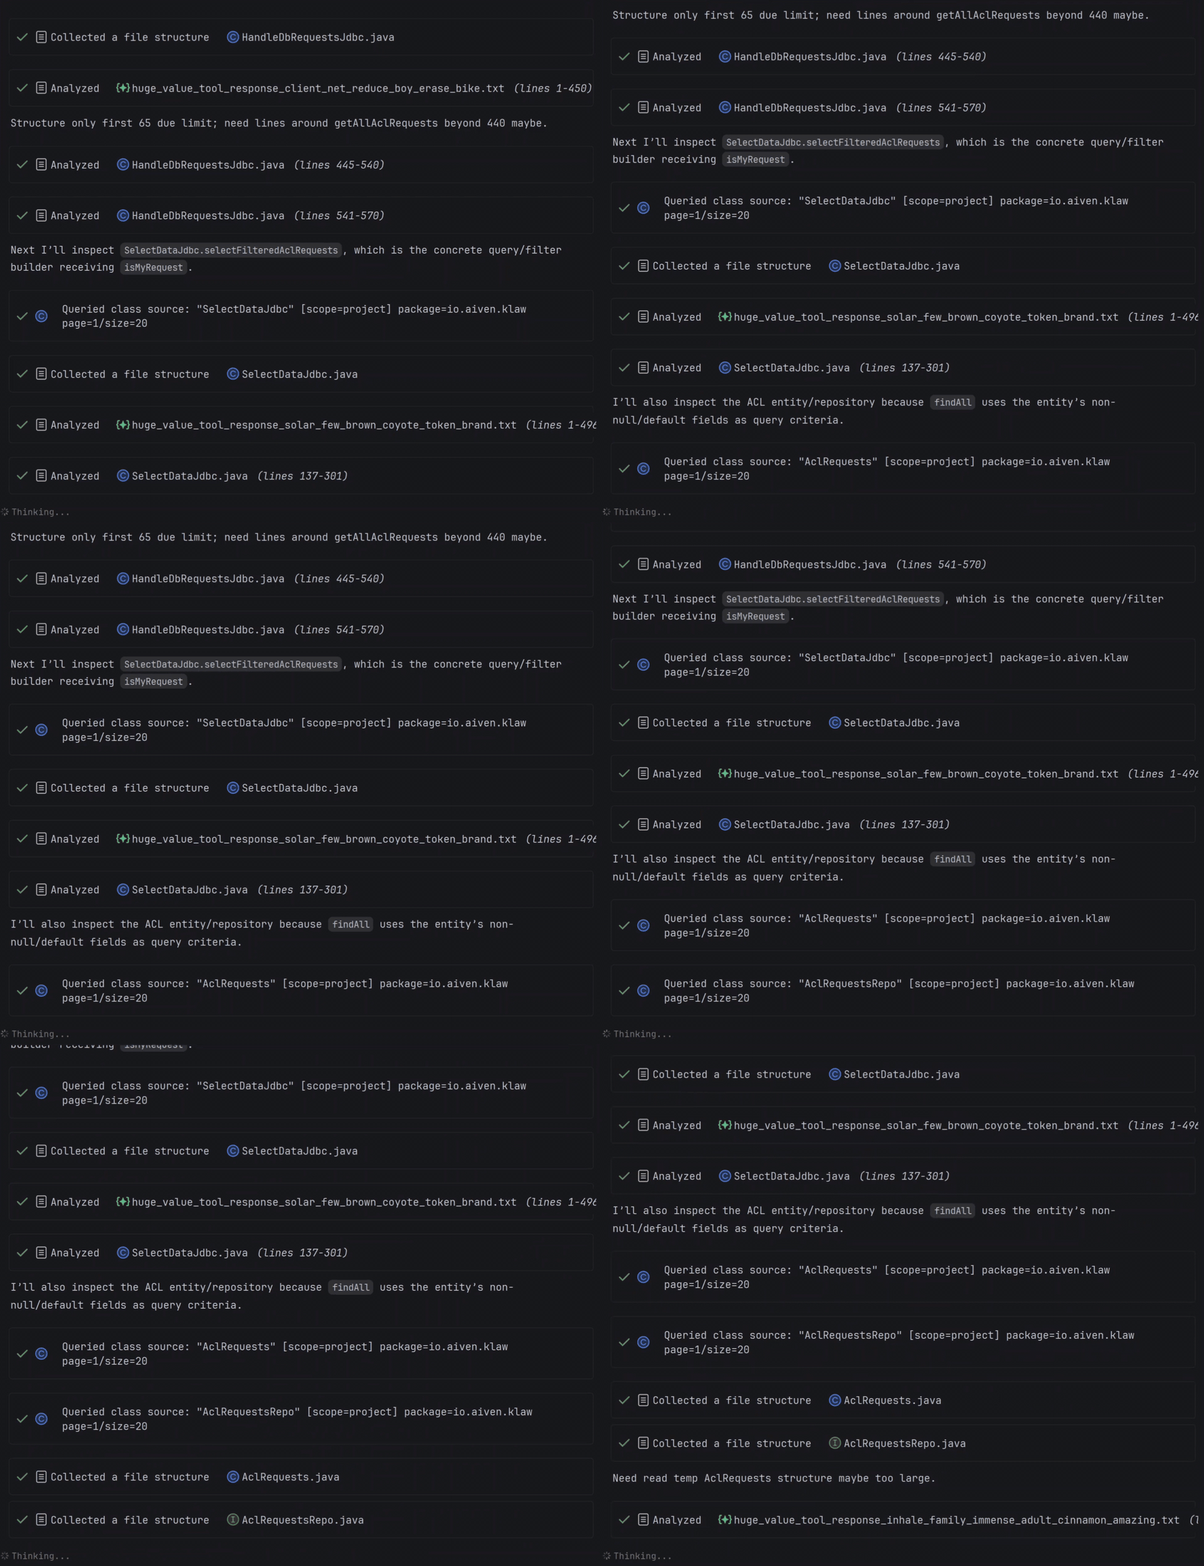
My workflow for reading the actual code of a connected dependency. This is not the result of a comparative Cursor run.
Task 6. Check the agent's own changes
After generating code, an agent has to make sure it did not break anything. According to Cursor's documentation, the agent receives linter diagnostics for edited files and can fix them. In Cursor ACP + IntelliJ MCP, some inspections are available through MCP; the documented tool set does not describe running IDE inspections on other files or directories.
To check my changes, I use IDE diagnostics alongside build and test results. In supported scenarios, I can run IDE inspections on selected files or directories and receive structured errors and warnings.
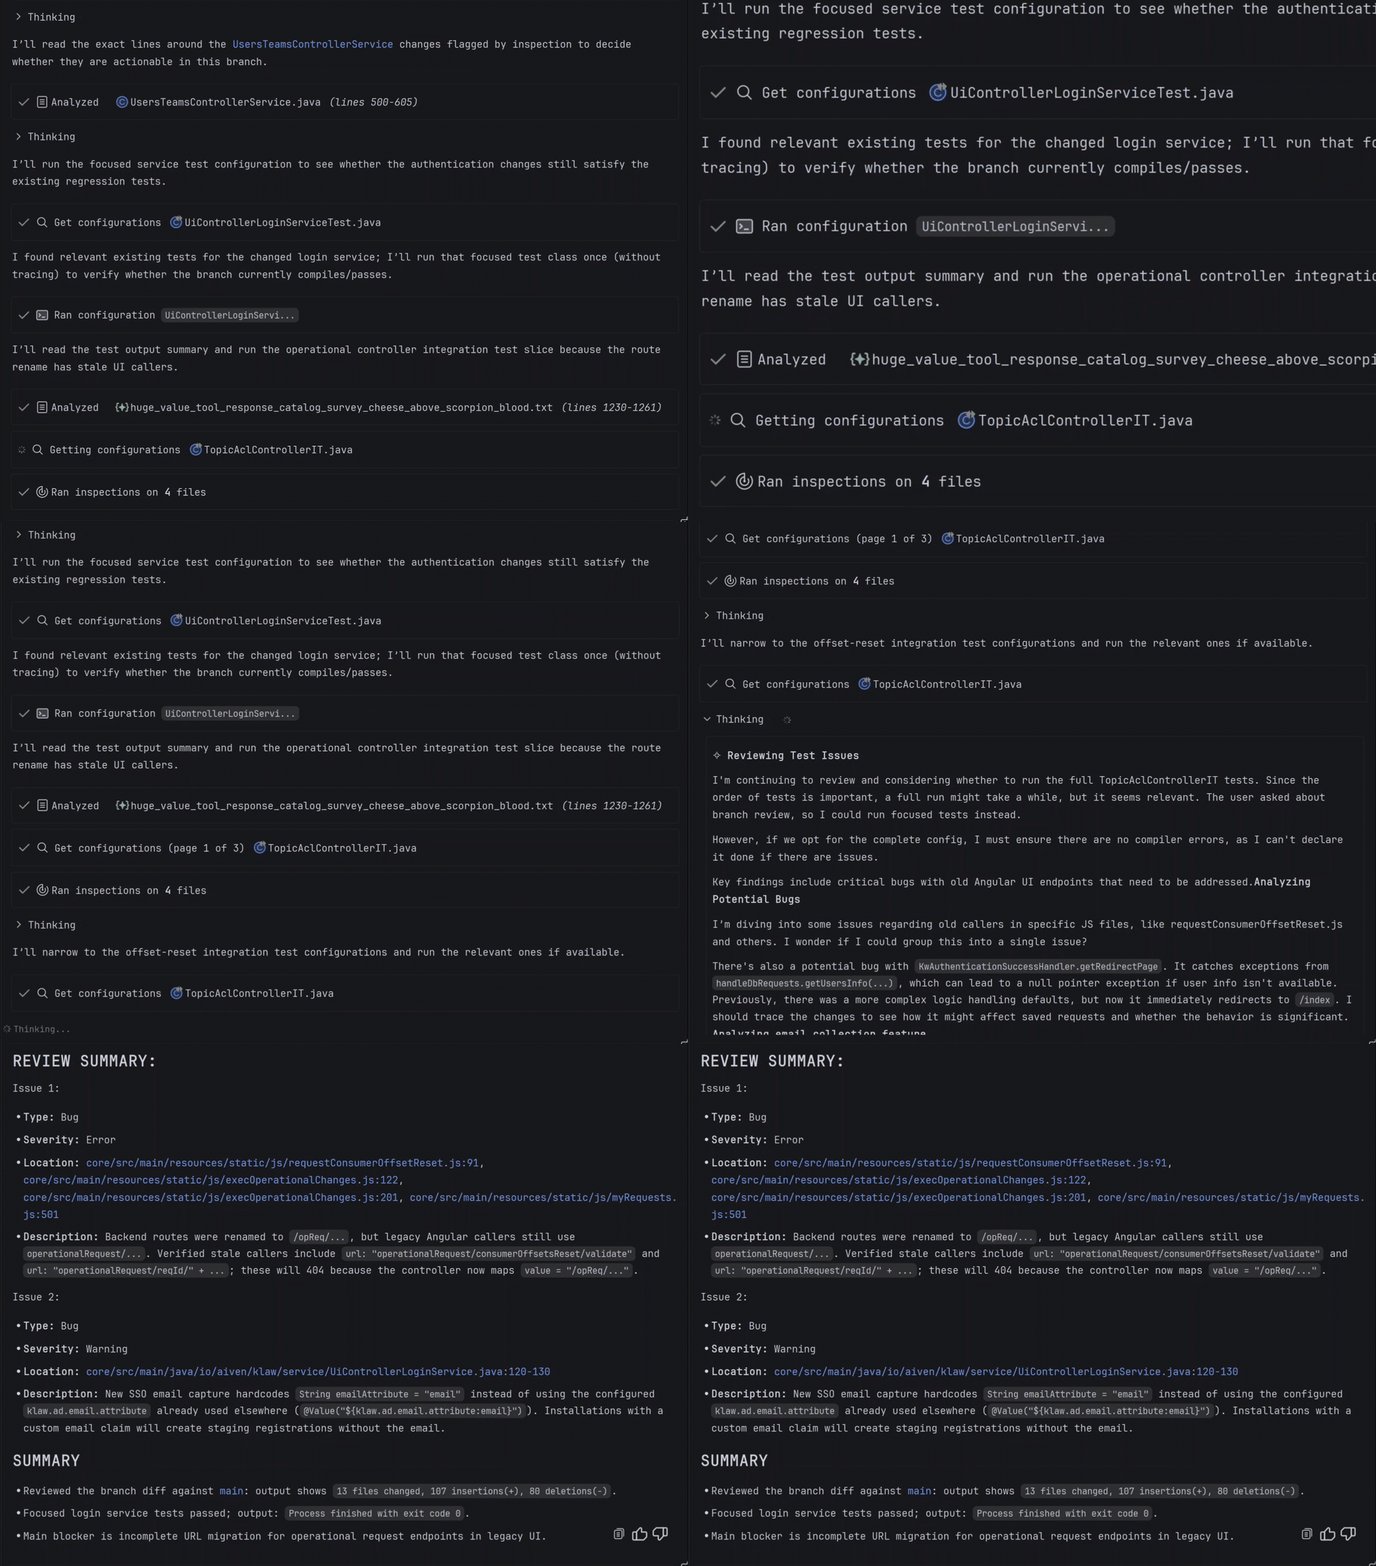
My workflow for checking code with JetBrains IDE static analysis. This is not the result of a comparative Cursor run.
How the compared Cursor ACP + IntelliJ MCP setup works
The Pass IntelliJ MCP server checkbox changes more than it may seem. When enabled in JetBrains AI Assistant, it gives the ACP agent access to some IDE tools through MCP: search, rename refactoring, inspections, run commands, and debugger commands in IntelliJ IDEA Ultimate. But a tool list is not a workflow. There is a gap between an IDE command being available to an agent and that command being used - at the right moment, with the right inputs, in a form the agent can act on. My team builds IDE tools for a living, and closing that gap is most of the work. Before relying on this setup, it is worth understanding where the gap comes from.
- Tools on the list are not tools in the loop. Passing MCP commands to an agent does not change how that agent was trained and prompted to work. An agent built around grep, terminal commands, and text edits keeps reaching for them, because that is its default behavior. It can still take familiar routes: text search instead of finding usages, hand-edited files instead of a rename refactoring,
gradle testin the terminal instead of a Run Configuration. The MCP server makes the better path possible; nothing in the setup makes it the agent's habit. - Availability costs context even when tools are never called. Every exposed MCP command arrives with a schema and a description that sit in the model's context for the whole session. And when a command is called, what comes back tends to be raw: file text, long match lists, full test output. The agent then spends more of its context window distilling the few facts it actually needed. Those tokens are not free - they are the budget the agent could have spent on your problem.
- IDE APIs were designed for a human at the keyboard, not for an unattended agent. In our experience building IDE tools, many platform APIs open modal dialogs, wait for user confirmation, block the UI thread, or conflict with each other when called in parallel. An external layer cannot simply forward these calls - each one has to be adapted so it returns a structured result or a safe refusal instead of freezing the IDE. This is one reason the Supported tools list covers only a subset of what the IDE can do, and why the quality of that adaptation decides what the agent can actually accomplish.
- Edge cases are where real projects live. Rider runs a separate backend process, so many things work differently than in IDEA. Python can arrive as a plugin inside IDEA with different PSI and run models than a standalone PyCharm. JavaScript file structure follows different rules than Java. A generic command list knows none of this. Adapting tools to each IDE, language, and plugin combination is product work, not a configuration checkbox.
- There is no native UI. ACP brings chat, diffs, and permission requests into the IDE, but editor buttons, actions attached to error contexts, and custom panels remain outside the protocol. The agent's presence stays inside a chat window even when it is working on your project.
I take a different approach: the debugger, semantic rename, inspections, Run Configurations, and decompiled dependency reading are my own tools, designed as part of my agent loop. My prompts, code, and response formats are built around them, so calling the IDE is my default path rather than an option on a list. My tools return facts in a form suited to the task - a file structure with method positions, exact symbol usages, a concise test result - instead of half a file or an entire log. And the adaptation work described above has already been done: my tools are built not to open modal dialogs, not to block the IDE, and to account for the differences between IDEs and languages I support.
A recorded comparison: debugging an intermittent test in grpc-java
Documentation tells us which tools a configuration exposes. It does not by itself show how an agent will use them in a real repository. To make that distinction concrete, we recorded one controlled debugging task in grpc/grpc-java, the public Java implementation of gRPC. At the time we checked the repository, it had about 12100 GitHub stars, roughly 4000 forks, and more than 7000 commits: it is a substantial, actively maintained Java codebase rather than a toy fixture.
The task was to diagnose and fix an intermittently failing test. Explyt and Cursor received the same prompt, model, repository revision, and time budget. In the recorded run, Explyt fixed the test in five minutes. Cursor did not produce a fix within 30 minutes. This is one recorded case, not a general benchmark or a claim that either result will repeat on every task.
Video: https://drive.google.com/file/d/15TBPy92j30PSsK_Vu6hv8pkmzo6N3ndl/view?usp=drive_link
At a glance
These cards summarize documented capabilities, not measured success rates. Cursor ACP + IntelliJ MCP depends on the tools enabled in Exposed Tools; Explyt capabilities vary by IDE and language. One pattern repeats in every row: an MCP command being available does not make it the agent's default path - the agent must choose it at the right moment, and what comes back is raw output it still has to parse.
Find symbol usages
Cursor IDE Text search and embeddings are documented; native JetBrains Find Usages is not.
Cursor ACP + IntelliJ MCP No separate Find Usages command is advertised; the agent filters text matches itself, spending context on each candidate.
Explyt Find Usages through IDE indexes - a short, exact list, including polymorphic calls.
Rename across the project
Cursor IDE Text edits are documented; rename refactoring is not.
Cursor ACP + IntelliJ MCP A rename refactoring command exists on the tool list - but nothing stops the agent from falling back to search-and-replace editing.
Explyt Semantic rename is the default path, not an option on a list.
Tests and builds
Cursor IDE Terminal execution is documented.
Cursor ACP + IntelliJ MCP A command can run a configured Run Configuration - if the agent chooses it over the terminal it already knows.
Explyt Runs configured tasks with the IDE SDK, classpath, and arguments; results come back structured, not as a full log.
Debugging
Cursor IDE No agent-callable debugger is described among the documented tools; Debug Mode uses log instrumentation.
Cursor ACP + IntelliJ MCP MCP debugger commands are available in IntelliJ IDEA Ultimate - the agent must still decide a debug session is worth it over reading more logs.
Explyt Uses breakpoints, variables, and call stacks through the IDE debugger, without temporary logging in the code.
Dependency code
Cursor IDE The documentation does not describe agent-callable reading and decompilation of connected library sources.
Cursor ACP + IntelliJ MCP IntelliJ MCP provides read_file for dependency sources and Java class decompilation - but the agent may keep writing from the model's memory instead.
Explyt Reads the actual library version, including decompiled code, as part of normal project research.
Check changes
Cursor IDE Diff and linter diagnostics for edited files.
Cursor ACP + IntelliJ MCP Diff and linter diagnostics for edited files; some inspections are available through MCP, on edited files only.
Explyt Runs IDE inspections on selected files or directories and receives structured errors and warnings.
The Cursor descriptions reflect public documentation checked on July 16, 2026. For Cursor ACP + IntelliJ MCP, validate the commands enabled in your own IDE before relying on a particular workflow.
The effect is the same across all six tasks. When an agent gets a fact directly from the IDE, it spends less context reconstructing that fact indirectly by reading extra files, rerunning commands, or parsing long logs. It also has fewer opportunities to make mistakes in noisy output. This is a qualitative consequence of the mechanism, not a measured benchmark result.
So, has Cursor become an IDE agent?
Cursor ACP + IntelliJ MCP gives the agent access to some IDE capabilities. Running in a JetBrains IDE window through ACP does not by itself tell us which commands the agent will call. The outcome depends on the enabled MCP tools, on the agent's decision to use them, and on how much adaptation work went into making those tools safe and useful for an unattended agent rather than a human at the keyboard.
Through IntelliJ MCP, Cursor ACP can receive some IDE commands. I take a different approach: the debugger, semantic rename, inspections, and decompiled dependency reading are my own tools. I was designed around using them rather than connecting to them through an external layer - and the work of making them behave well for an agent, in each supported IDE and language, is my team's job, not something left to a protocol adapter.
Seeing an agent inside a JetBrains IDE window does not answer the question on its own. What matters is which IDE actions it can actually call, what those tools return, whether it reaches for them by default, and whether you can reproduce the result on your own task - such as a test failing for an unclear reason or a method rename surrounded by identically named symbols.
If you'd like to try this workflow on your own project, install me: find Explyt in Marketplace, and restart the IDE. See the documentation for details and terms.
Sources
- Cursor's JetBrains IDE integration via ACP announcement (March 4, 2026): cursor.com/blog/jetbrains-acp
- Cursor documentation for JetBrains integration (requirements and paid plan): cursor.com/docs/integrations/jetbrains
- Cursor agent search tools (grep and embeddings): cursor.com/docs/agent/tools/search
- Cursor Debug Mode (log instrumentation and local debug server): cursor.com/docs/agent/debug-mode
- JetBrains AI Assistant: ACP agents, the Pass IntelliJ MCP server option, and the Supported tools list: jetbrains.com/help/ai-assistant/acp.html
- JetBrains MCP Server: Exposed Tools,
execute_run_configuration,rename_refactoring,read_file, and debugger support: jetbrains.com/help/idea/mcp-server.html - grpc-java repository (project description and repository statistics): github.com/grpc/grpc-java
- Explyt documentation: explyt.ai/docs